Deconstructing protein phase diagrams
In the process of coming up with new exam questions for my undergraduate thermodynamics and condensed matter course I came across the following pressure-temperature phase diagram for the protein ribonuclease A at pH 2.0.
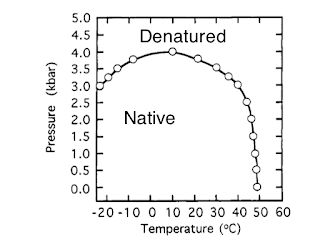 It is taken from a 1995 Biochemistry paper and I came across it in the wonderful text by Dill and Bromberg.
[Aside: I wondered if the water freezing was an issue but all along the curve the solvent water is liquid because dP/dT is negative for the liquid-solid line of pure water].
Natural scientific questions are:
One simply expands the Gibbs free energy change to second order in T and P relative to some reference pressure P0 and temperature T0,

 The pressure induced denaturation can then lead to a volume contraction. This is explained in microscopic terms in a 1998 PNAS paper by Hummer et al.,
Pressure-denatured proteins, unlike heat-denatured proteins, retain a compact structure with water molecules penetrating their core.

[Aside: I wondered if the water freezing was an issue but all along the curve the solvent water is liquid because dP/dT is negative for the liquid-solid line of pure water].
Natural scientific questions are:
- What are the mechanisms of "cold" and pressure-induced denaturation?
- What are the associated changes in protein structure?
- Is this a generic type of phase diagram for proteins?
- What role does water and hydrophobic interactions play?
One simply expands the Gibbs free energy change to second order in T and P relative to some reference pressure P0 and temperature T0,


The pressure dependence of hydrophobic interactions is consistent with the observed pressure denaturation of proteins
which showsPressure-denatured proteins, unlike heat-denatured proteins, retain a compact structure with water molecules penetrating their core.

Comments
Post a Comment